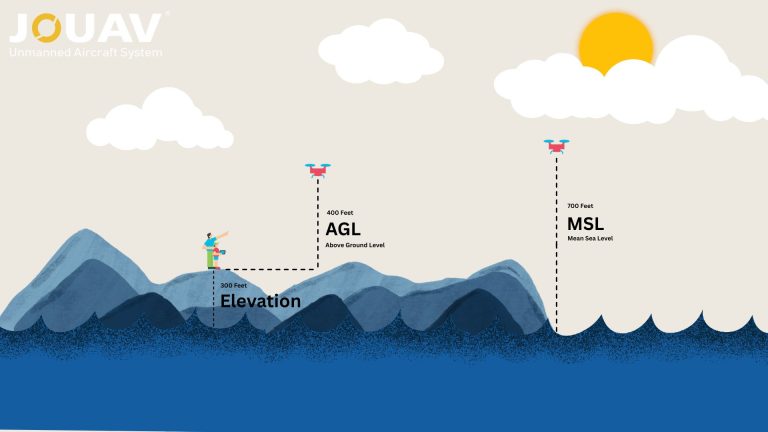
In aviation, precision isn’t just a goal—it’s a necessity. Every altitude reading, flight path, and safety protocol hinges on understanding two critical measurements: Mean Sea Level (MSL) and Above Gr
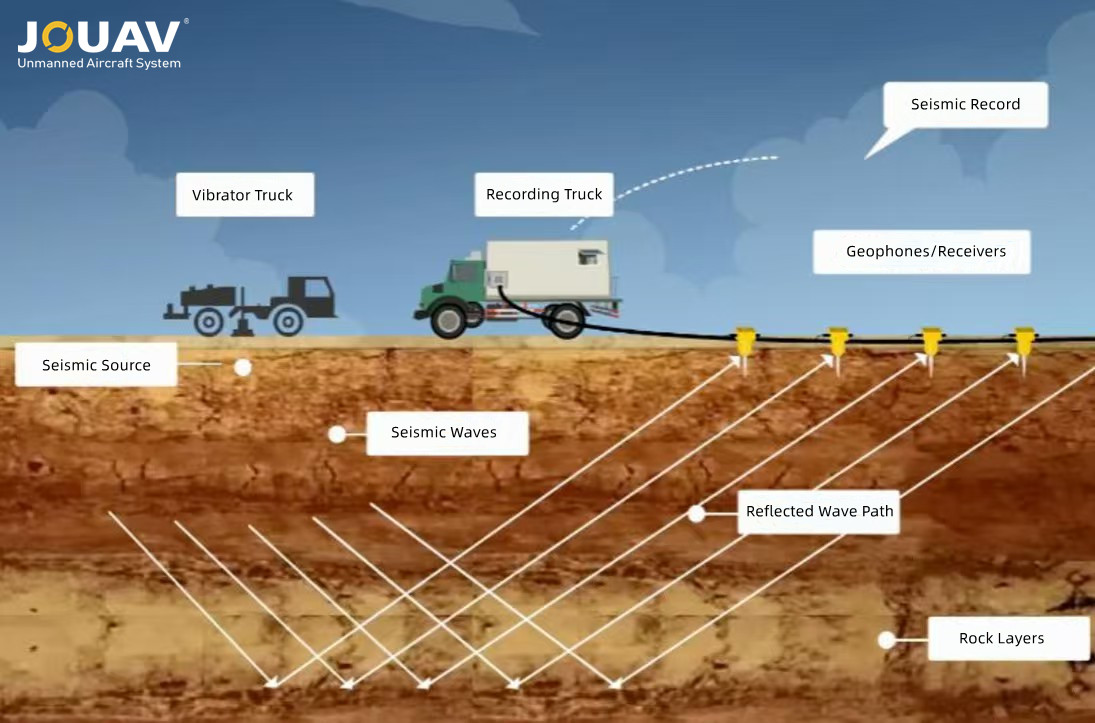
How Does a Seismic Survey Work?
It starts by making controlled vibrations, or sound waves, using specialized equipment.
On land, that might be vibrating trucks (vibroseis), explosives, or heavy weights dropped on the surface.
At sea, ships tow devices known as airguns that fire pressurized air bubbles, creating sound pulses underwater.
These waves travel downward and rebound off different layers of rock, faults, or reservoirs. The arriving echoes are picked up by sensors known as geophones (onshore) or hydrophones (marine).
The waves' bounceback time, strength, and direction are quantified.
Complex computer software then interprets this data to create graphical representations of the subsurface—a 2D cross-section, a 3D volume, or even a 4D time-lapse model that shows change over the years.
What Type of Data is Recorded During a Seismic Survey?
Seismic surveys generate vast amounts of data to create detailed images of the Earth’s subsurface. These datasets are critical for interpreting geological structures, identifying resources, and mitigating risks.
1. Raw Seismic Wave Data
The foundation of any seismic survey is the raw seismic signal, which captures the interaction of sound waves with subsurface layers. This includes:
- Amplitude: The strength of the reflected or refracted wave, which indicates the contrast in rock properties (e.g., density, porosity).
- Travel Time: The time taken for a wave to travel from the source to a receiver, used to calculate the depth of subsurface layers.
- Frequency: The range of frequencies in the wave, affects resolution (high frequencies for shallow details, low frequencies for deep imaging).
An example of raw seismic data. Source from researchgate.net.
2. Source and Receiver Metadata
Accurate positional and operational data is recorded to ensure precise interpretation.
Source Parameters:
- Source type (e.g., airgun, vibroseis truck, explosive charge).
- Source location (GPS coordinates).
- Energy output (e.g., airgun pressure, vibrator sweep frequency).
Receiver Parameters:
- Geophone/hydrophone locations (spatial coordinates).
- Sensor sensitivity and orientation (e.g., vertical or multi-component geophones).
3. Seismic Shot Records
A shot record (or seismic trace) is a dataset capturing all waves detected by receivers after a single source activation. Each trace includes:
- Direct Waves: Waves traveling directly from the source to receivers (used to calibrate near-surface velocity).
- Reflected Waves: Waves bouncing off subsurface interfaces (e.g., rock layers).
- Refracted Waves: Waves bending along layer boundaries (common in shallow surveys).
- Surface Waves: Low-frequency waves traveling along the ground (often filtered out during processing).
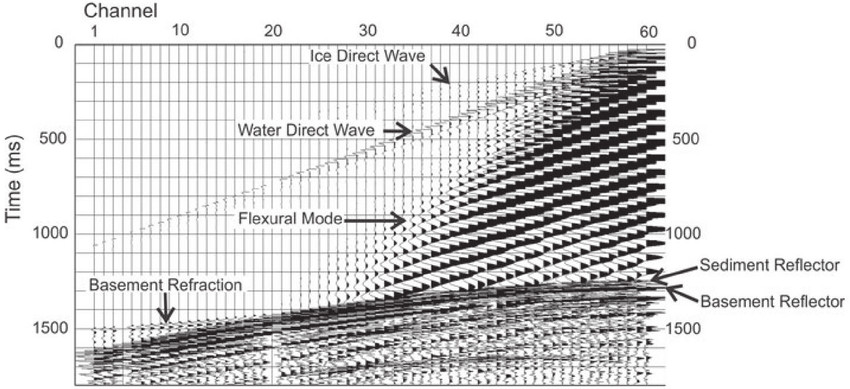
Raw shot record with seismic events labeled. Source from researchgate.net.
4. Time-Series Data
Seismic surveys record time-series data, where each receiver’s output is a continuous waveform over milliseconds to seconds. This data is digitized and stored as:
- Sampling Rate: Typically 1-4 milliseconds for high-resolution surveys.
- Recording Duration: 6–15 seconds, depending on target depth.
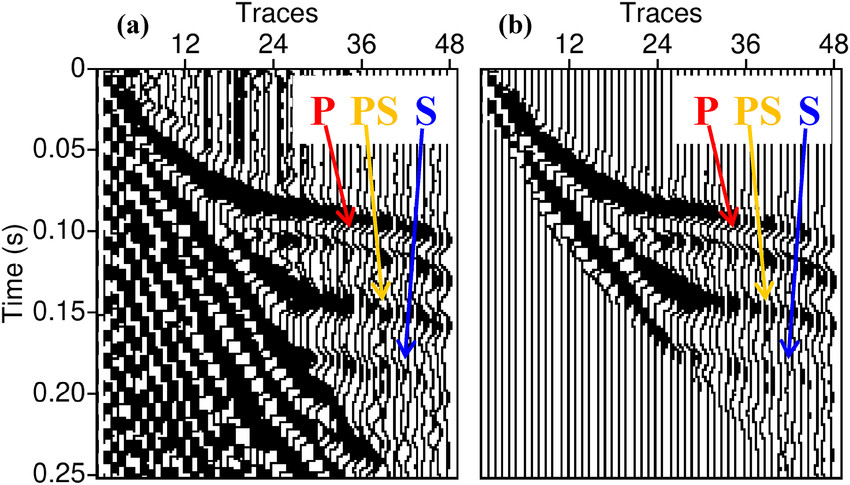
5. Multi-Component Data
Advanced surveys use 3C (three-component) geophones or 4D ocean-bottom nodes to record:
- Vertical (P-wave) Motion: Compressional waves moving through the rock.
- Horizontal (S-wave) Motion: Shear waves provide rock rigidity data.
- Polarization: Direction of wave movement, useful for fracture analysis.
6. Environmental and Noise Data
Background noise is recorded to improve signal quality during processing.
- Cultural Noise: Human-made vibrations (e.g., traffic, machinery).
- Ambient Noise: Natural vibrations (e.g., wind, waves, animal movement).
- Weather Data: Temperature, wind speed, and sea state (for marine surveys).
7. Velocity Data
Seismic velocity (the speed at which waves travel through materials) is derived from:
- First Breaks: The arrival time of the first wave at each receiver, used to model near-surface velocity.
- Velocity Analysis: Post-processing techniques (e.g., NMO correction) to estimate layer velocities.
8. Auxiliary Data
Supplementary datasets enhance interpretation.
- Gravity/Magnetic Data: Correlated with seismic to identify basement structures or igneous intrusions.
- Well Logs: Used to calibrate seismic data with borehole measurements (e.g., porosity, lithology).
- Satellite Imagery: Guides onshore survey planning to avoid sensitive areas.
9. Processed Data Products
After acquisition, raw data is transformed into actionable insights:
- Stacked Sections: Combined traces to improve signal-to-noise ratio.
- Migrated Images: Depth-corrected 2D/3D volumes showing true subsurface geometry.
- Attribute Volumes: Derived properties like acoustic impedance, AVO (Amplitude vs. Offset), or coherence to highlight fluid contacts or fractures.
10. 4D (Time-Lapse) Data
In 4D surveys, repeated 3D datasets are compared to track changes over time:
- Pressure/Saturation Changes: Differences in amplitude or travel time reveal fluid movement.
- Subsidence Monitoring: Detects ground settling due to reservoir depletion.
Seismic Survey Equipment
Seismic surveys rely on advanced equipment and technology to generate, capture, and analyze waves that reveal the Earth’s hidden layers.
Seismic Sources
- Vibroseis Trucks: Onshore vehicles that transmit controlled vibrations into the ground. Ideal for environmentally sensitive areas, as they replace explosive charges.
- Explosives: Dynamite or buried charges used in remote regions for high-energy, deep-penetration surveys.
- Airguns: Offshore systems that release compressed air bubbles, creating sound waves for marine surveys. Mitigated by “soft-start” protocols to protect marine life.
- Weight-Drop Systems: Portable sources that drop heavy weights onto the ground, often used in shallow geotechnical studies.
Receivers
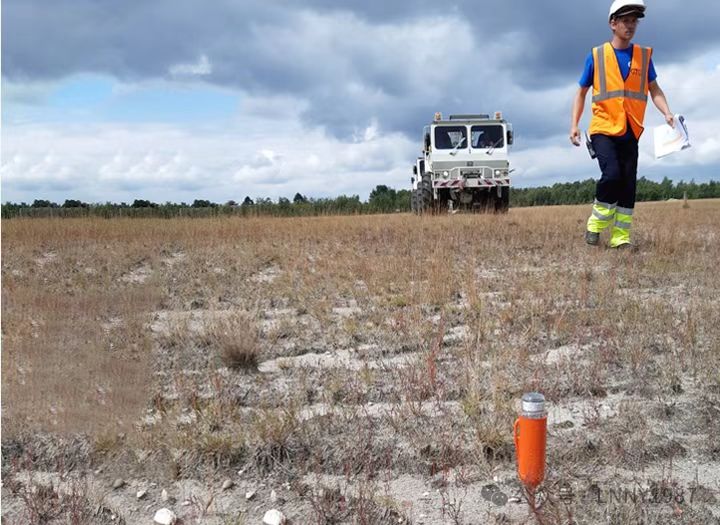
- Geophones: Onshore sensors planted in the ground to measure vertical or horizontal vibrations. Modern wireless geophones reduce cabling and deployment time.
- Hydrophones: Underwater microphones towed behind ships or anchored to the seafloor for marine surveys.
- MEMS (Micro-Electro-Mechanical Systems): Compact, high-sensitivity accelerometers embedded in geophones for improved signal-to-noise ratios.
- Distributed Acoustic Sensing (DAS): Fiber-optic cables that act as continuous strain sensors, ideal for permanent reservoir monitoring or urban studies.
Recording Systems
- Digital Recorders: Rugged units that filter noise and store terabytes of raw waveform data.
- Wireless Telemetry: Transmits real-time data from receivers to centralized units, enabling instant quality checks.
- Cloud Computing: Offloads heavy processing (e.g., reverse-time migration) to remote servers, accelerating turnaround times.
Seismic Refraction Surveys
Refraction surveys analyze seismic waves that bend (refract) at subsurface interfaces, such as boundaries between rock layers or soil types.
These waves travel along the interface before returning to the surface, with arrival times measured to calculate layer depths and velocities.
A seismic source (e.g., hammer strike or explosive charge) generates waves, and geophones placed along a transect record their arrival.
GIS software processes the data to create velocity-depth models, highlighting contrasts in material hardness or density.
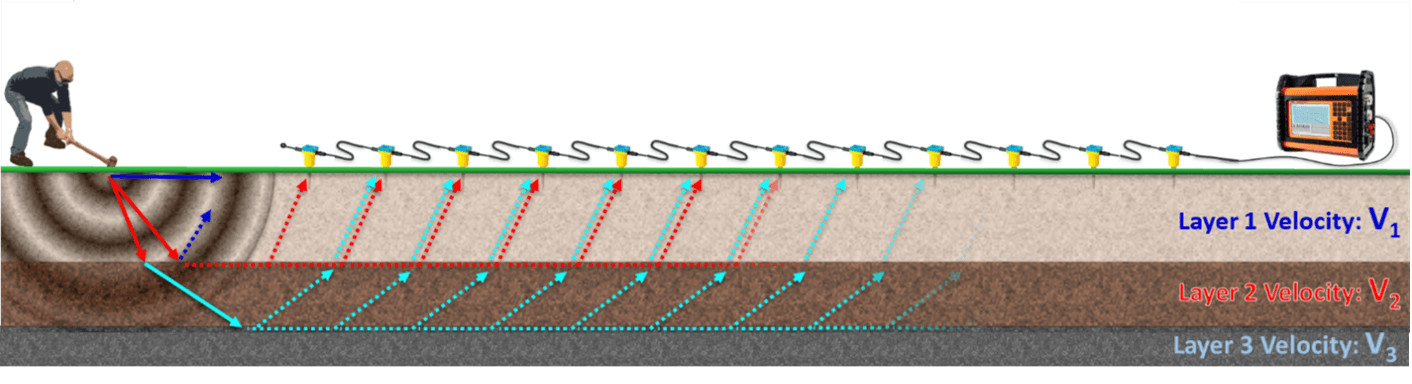
Refraction seismic. Source from guidelinegeo.com.
Applications:
- Ideal for shallow subsurface mapping (≤100m depth), such as bedrock profiling for infrastructure projects.
- Identifying groundwater tables or fault zones in environmental studies.
- Assessing landslide risks by detecting weak soil layers.
Limitations: Struggles with low-velocity layers (e.g., loose sediments) beneath high-velocity layers, as refracted signals may not return to the surface.
Seismic Reflection Survey
Reflection surveys focus on waves that bounce off subsurface interfaces, similar to how sonar maps ocean floors. The time delay and amplitude of reflected waves reveal layer depths, angles, and material properties.
High-energy sources (vibrators, airguns) emit waves, and geophone/hydrophone arrays capture reflections.
Advanced processing—often involving seismic attribute analysis—translates raw data into 2D/3D/4D visualizations of stratigraphy, hydrocarbon reservoirs, or aquifers.
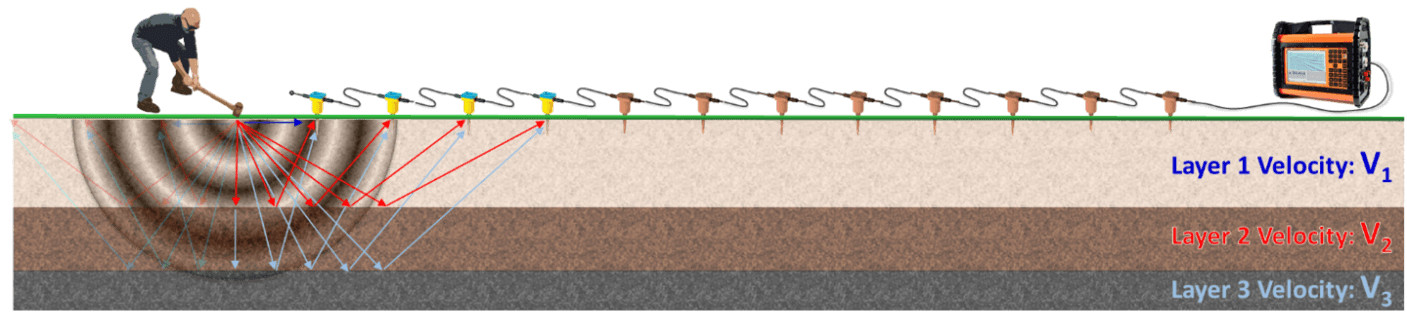
Reflection seismic. Source from guidelinegeo.com.
Applications:
- Dominates oil and gas exploration, imaging reservoirs several kilometers deep.
- Mapping geologic structures (folds, faults) for earthquake risk assessments.
- 4D surveys monitor fluid movements in reservoirs during extraction or CO₂ sequestration.
Limitation: High costs and computational demands, especially for 3D/4D surveys. Signal noise in complex terrains (e.g., mountainous regions) can reduce clarity.
Surface-Wave Survey
Surface-wave methods exploit the dispersion of Rayleigh or Love waves, which travel along the Earth’s surface.
Their velocity varies with frequency, providing insights into shear-wave velocity profiles of near-surface materials.
Passive (ambient noise) or active (mechanical sources) waves are recorded by closely spaced geophones.
Multichannel Analysis of Surface Waves (MASW) is a common technique, generating shear-wave velocity models to infer soil stiffness or compaction.
Applications:
- Engineering site characterization (e.g., evaluating liquefaction risks for buildings).
- Urban planning through non-invasive mapping of shallow utilities or landfill stability.
- Agricultural optimization by assessing soil layering and moisture content.
Limitations: Limited to shallow depths (typically <30m) and less effective in heterogeneous or highly consolidated terrains.
Seismic Survey Methods
Among the most widely used seismic survey methods are 2D, 3D, and 4D seismic surveys, each tailored to specific exploration stages and objectives.
2D Seismic Survey
2D surveys use straight lines of receivers to generate vertical cross-sections of the subsurface.
They’re fast, affordable, and ideal for initial exploration in frontier regions, revealing large-scale structures like sedimentary basins or fault systems.
However, gaps between survey lines can miss complex features, making them less reliable for detailed resource estimation.
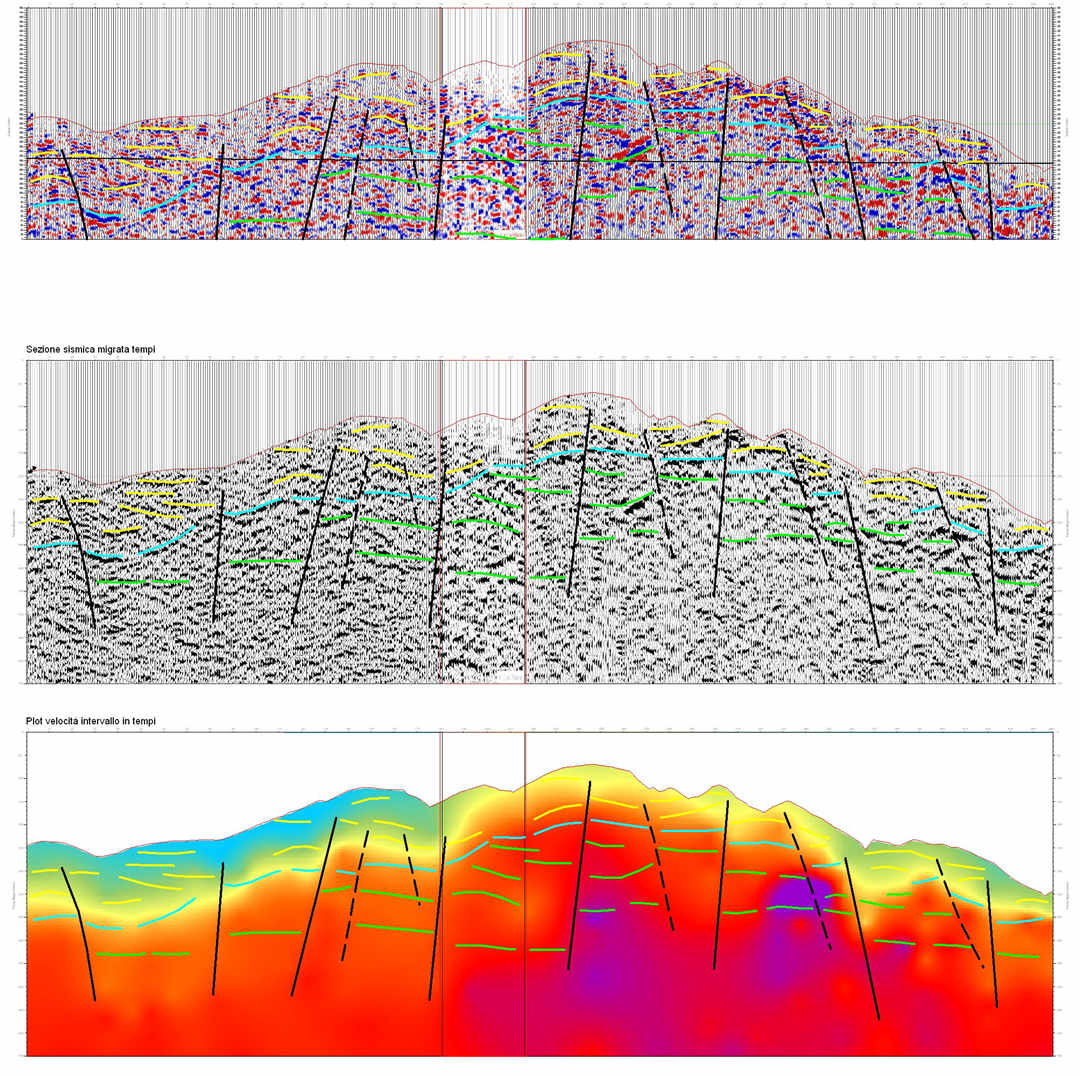
2D seismic reflection with interpretative structural model: (from the top) – time to depth migrated section, two way time migrated section, interval velocity section. Source from geco-dmc.com.
3D Seismic Surveys
3D surveys deploy grids of sources and receivers to create 3D volumetric images of the subsurface.
Offshore, this involves towing multiple hydrophone cables; onshore, receiver “patches” capture dense data.
The method reduces drilling risks by resolving intricate stratigraphy and guiding horizontal wells but requires significant time and budget.
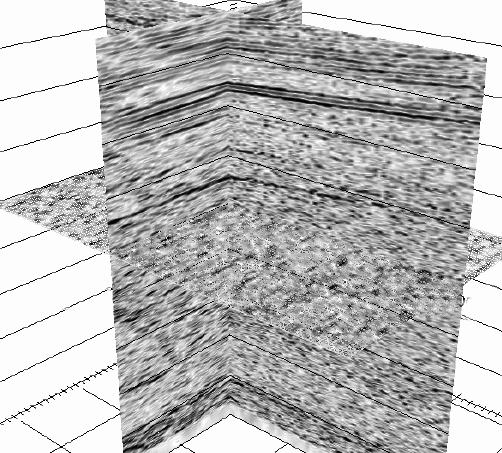
3D seismic reflection. Source from geco-dmc.com.
4D (Time-Lapse) Seismic Surveys
4D surveys repeat 3D acquisitions over time to monitor subsurface changes, such as fluid movement in reservoirs or CO₂ storage sites.
While costly and logistically demanding, they offer unparalleled insights into dynamic processes like hydrocarbon depletion or landslide dynamics.
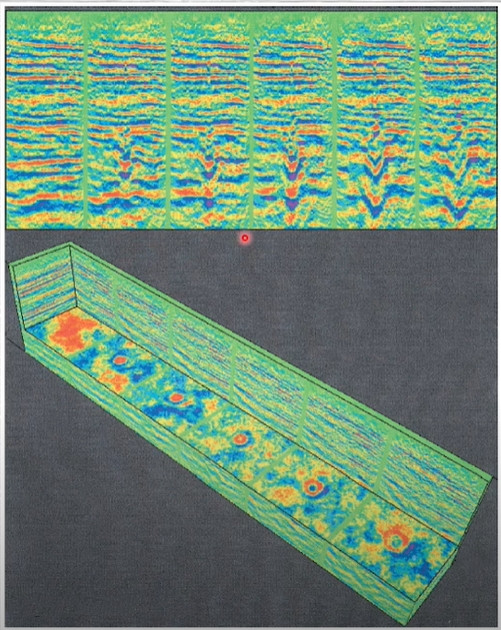
Time lapse 4d seismic data. Image source from Brown textbook.
To sum up: 2D vs. 3D vs. 4D Seismic Surveys
2D provides a single vertical slice of the subsurface, useful for initial exploration but limited in detail. 3D, the industry standard, creates a 3D volume of the subsurface, enabling precise reservoir mapping and reducing drilling risks. 4D (time-lapse) compares repeated 3D surveys over time to track fluid movement and optimize production in active fields.
While 2D is cost-effective for broad scans, 3D’s accuracy drives exploration and development, and 4D enhances recovery in mature reservoirs by adding a dynamic time dimension.
5 Major Challenges of Seismic Survey
Inaccessible or Hazardous Terrain
Rugged environments like mountains, deserts, dense forests, and wetlands are difficult to access with conventional ground equipment. Transporting heavy gear (e.g., vibroseis trucks, explosives) requires constructing temporary roads, which damages ecosystems and inflates costs.
In the Canadian Rockies, crews often spend weeks clearing paths through snow and rock to deploy sensors, delaying projects by months.
High Costs and Time Delays
Mobilizing large crews, specialized vehicles, and equipment to remote sites is expensive. Weather delays, equipment failures, or logistical bottlenecks further strain budgets.
Onshore 3D seismic projects can cost 10,000–50,000 per square kilometer, with offshore surveys exceeding $1 million daily.
Safety Risks for Personnel
Workers face hazards like landslides, extreme weather, unstable terrain, and exposure to explosives or heavy machinery.
In 2019, a geophysicist in Alaska suffered injuries while retrieving sensors from a glacier crevasse, highlighting fieldwork dangers.
Data Accuracy and Resolution Limitations
Sparse sensor placement in hard-to-reach areas creates data gaps, reducing subsurface model accuracy. Complex geology (e.g., salt domes, fractured reservoirs) further distorts signals.
In the Gulf of Mexico, sparse ocean-bottom node (OBN) coverage led to misinterpretation of a salt body, resulting in a $20 million dry well.
Environmental and Regulatory Constraints
Strict environmental laws (e.g., EPA regulations, EU Habitat Directives) mandate minimal disruption to wildlife and ecosystems.
Traditional methods, such as explosive charges or ground crews, risk disturbing habitats, contaminating water sources, or violating indigenous land rights.
A survey in the Amazon rainforest was halted after manual sensor deployment damaged protected vegetation, resulting in fines and community backlash.
How Drones Are Tranforming Seismic Surveys?
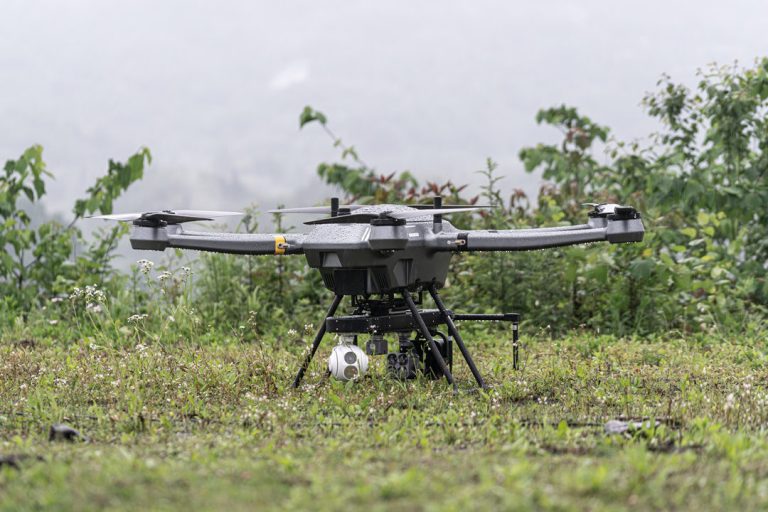
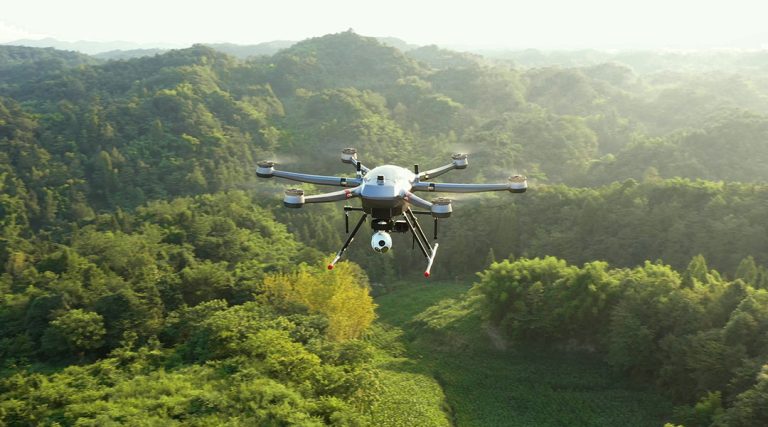
Drones like the JOUAV PH-20 are revolutionizing seismic exploration by overcoming these challenges with advanced technology and innovative workflows.
Smarter Terrain Mapping with Aerial Precision
Instead of relying on slow and potentially hazardous ground surveys, drones equipped with LiDAR and photogrammetry can rapidly generate detailed 3D terrain models.
These models provide accurate insights into ground conditions, enabling geologists to identify optimal sensor placement and safe access routes, minimizing the need for extensive ground reconnaissance and infrastructure development.
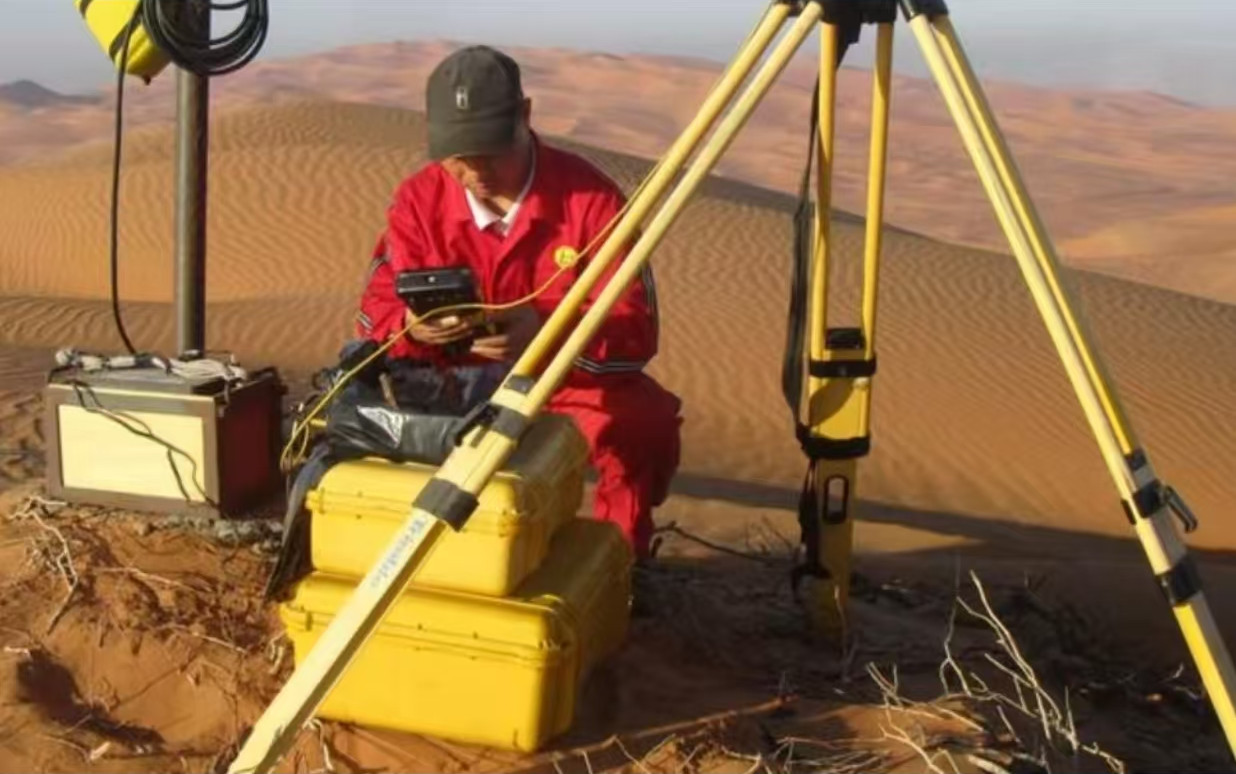
Safe, Accurate Sensor Deployment in High-Risk Zones
Drones like the PH-20, equipped with heavy-lift capacity and RTK and PPK technology, can accurately place seismic sensors at predefined locations, even in difficult terrain.
Automated deployment eliminates the need for personnel to access hazardous areas, significantly improving safety and reducing deployment time.
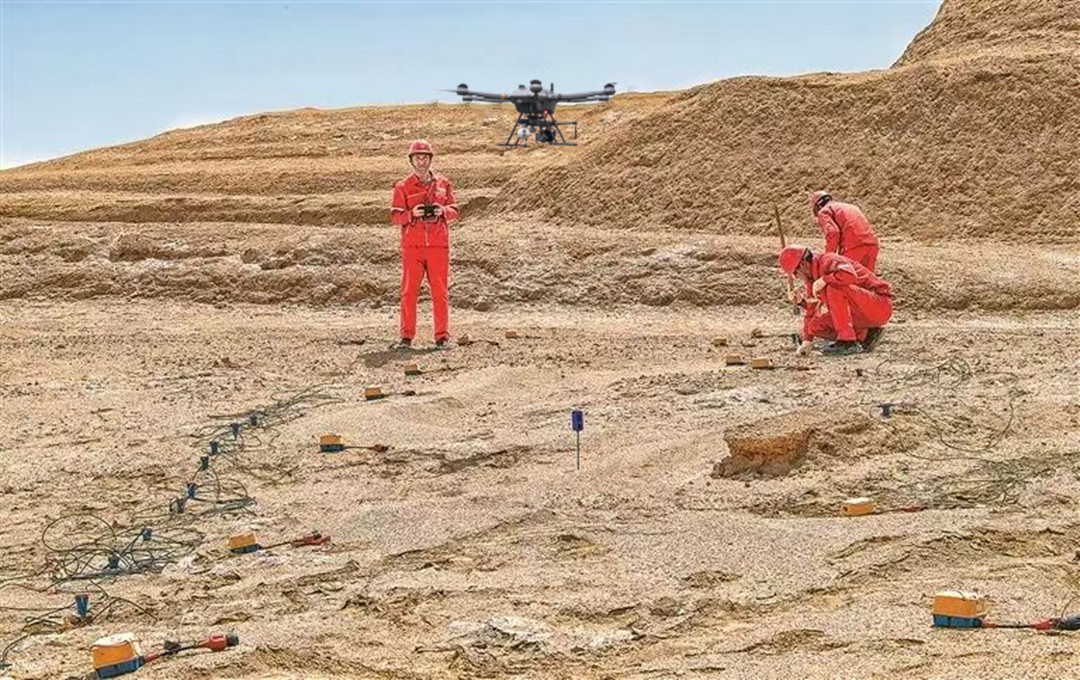
The JOUAV PH-20 was used for seismic survey.
Faster, Safer Data Collection at Scale
Drones can automate data collection from widely dispersed wireless sensors, eliminating the need for time-consuming and costly manual retrieval.
Their extended flight endurance and automated flight paths allow for efficient data download via Wi-Fi or RFID, providing real-time information to on-site teams.
Proactive Environmental Protection and Compliance
Drones equipped with thermal cameras and multispectral sensors can monitor ecological conditions and detect potential environmental hazards.
This capability allows for real-time tracking of vegetation health, detection of gas leaks, and documentation of wildlife activity, facilitating compliance with environmental regulations and minimizing ecological impact.
What Are Seismic Surveys Used for?
Oil and Gas Exploration
Seismic surveys are synonymous with the oil and gas industry, where they play a pivotal role in locating hydrocarbon reserves.
By generating detailed 2D, 3D, or 4D images of subsurface structures, these surveys identify traps like anticlines, fault blocks, and salt domes that may hold oil or gas.
Advanced 3D seismic data reduces drilling risks by pinpointing optimal well locations, while 4D (time-lapse) surveys monitor reservoir changes during production, ensuring efficient resource recovery.
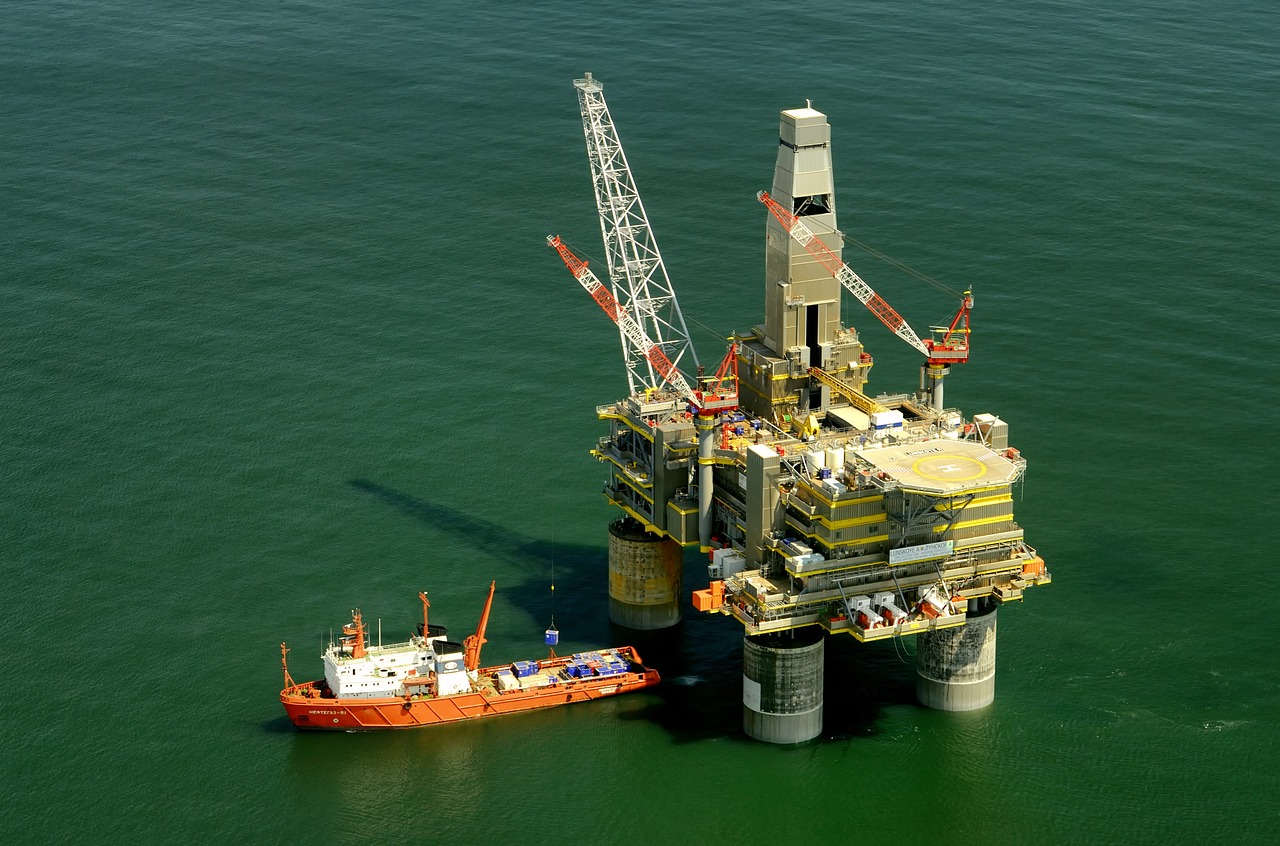
Offshore, seismic vessels with airgun arrays map ocean floors to discover deepwater reserves, while onshore vibroseis trucks and geophone arrays are used in shale plays and conventional fields.
Geological Mapping
Seismic surveys are critical for geological mapping, helping scientists visualize subsurface rock layers, fault systems, and tectonic features.
Governments and academic institutions use these surveys to study sedimentary basins, volcanic formations, and mineral deposits.
For example, reflection seismic methods can map the boundaries of ancient rift basins, while refraction surveys reveal the Mohorovičić discontinuity (Moho), the boundary between the Earth’s crust and mantle.
This data supports natural resource management, hazard assessment, and academic research.
Groundwater Exploration
In regions facing water scarcity, seismic surveys are used to locate and characterize aquifers.
By analyzing how seismic waves travel through porous vs. impermeable layers, hydrogeologists identify groundwater reservoirs, estimate their depth and volume, and assess recharge rates.
Refraction surveys are particularly effective for mapping shallow aquifers in arid regions, while surface-wave methods evaluate soil compaction and saltwater intrusion risks in coastal areas.
Engineering and Construction
Before breaking ground on infrastructure projects—from skyscrapers to dams—engineers use seismic surveys to assess soil stability and bedrock depth.
High-resolution surface-wave surveys measure shear-wave velocity to classify soil stiffness, ensuring foundations can withstand loads.
Crosshole seismic methods evaluate tunnel routes, while refraction surveys detect voids or sinkholes that could compromise structures.

Earthquake Studies
Seismic surveys are instrumental in earthquake hazard assessment. By mapping active fault lines and measuring ground stiffness, geophysicists predict how an area will shake during an earthquake.
Downhole surveys calculate shear-wave velocity to classify site-specific seismic risk (e.g., NEHRP soil types), while reflection surveys image fault geometries at depth.
This data informs building codes and evacuation plans in earthquake-prone regions like Japan or California.
Environmental Studies
Environmental scientists use seismic surveys to monitor subsurface contamination, assess landfill stability, and study ecosystems. For instance:
- Contaminant Plumes: Reflection surveys track the spread of pollutants in groundwater.
- Carbon Capture: 4D seismic monitors CO2 storage in underground reservoirs.
- Marine Life Impact: Surveys evaluate how offshore seismic pulses affect whales and dolphins, leading to stricter regulations like "marine mammal observers" on vessels.
Environmental Impact of Seismic Survey
Seismic surveys can have significant environmental impacts, particularly in marine environments. Here's a detailed breakdown:
Marine Ecosystems: Noise Pollution and Wildlife Disruption
In marine environments, seismic surveys typically deploy airguns that release high-pressure air pulses, generating sound waves exceeding 250 decibels—louder than a rocket launch. These pulses occur every 10–15 seconds, often for weeks or months, creating pervasive underwater noise.
- Marine Mammals: Species like whales, dolphins, and porpoises rely on echolocation and acoustic communication. Prolonged exposure to seismic noise can cause temporary or permanent hearing loss, disrupt feeding and mating behaviors, and induce stress. For example, studies in the North Atlantic linked seismic surveys to reduced vocalizations in endangered right whales, hindering their ability to locate mates.
- Fish and Invertebrates: Noise pollution alters fish behavior, including migration patterns and spawning activities. Larval mortality rates increase due to acoustic trauma, while species like squid and zooplankton suffer physiological damage. In Norway, herring fisheries reported declines during seismic operations, suggesting ecosystem-wide ripple effects.
- Cumulative Impacts: Repeated or overlapping surveys amplify these effects, particularly in biodiverse regions like the Arctic or coral reef zones.
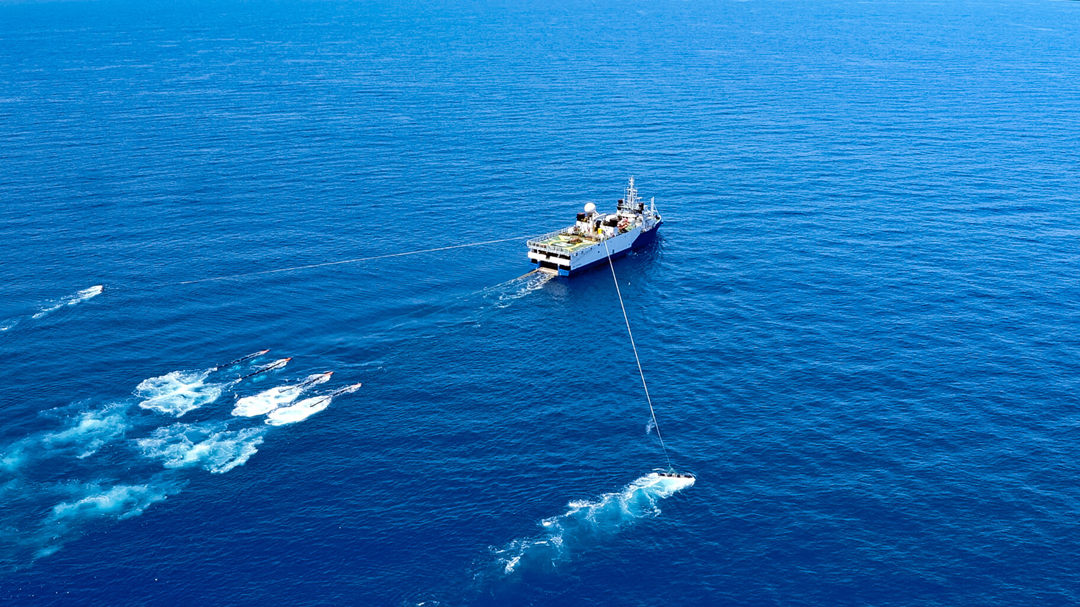
AIMS scientists use specialized seismic vessels to assess the impact of survey-generated noise on the marine environment. Image credit: Copyright AIMS.
Terrestrial Ecosystems: Habitat Fragmentation and Pollution
On land, seismic surveys involve heavy machinery (e.g., vibroseis trucks), explosives, and extensive crew movements, leading to:
- Habitat Destruction: Vehicles and equipment compact soil, damage vegetation, and fragment habitats, threatening species like caribou or nesting birds. In Alberta’s boreal forests, seismic lines have disrupted predator-prey dynamics and facilitated invasive species spread.
- Chemical Contamination: Explosives used in shot holes (e.g., dynamite) may leach toxic chemicals like perchlorates into groundwater, risking contamination of drinking water and aquatic ecosystems.
- Noise Disturbance: Land surveys generate noise levels up to 120 decibels, disturbing wildlife and livestock. In Wyoming, mule deer herds were observed altering migration routes to avoid active survey zones.

Broader Ecological and Climate Impacts
- Carbon Footprint: Seismic operations rely on fuel-intensive vessels and vehicles. A single offshore survey ship can emit 100+ tons of CO2 daily, contributing to climate change.
- Indirect Effects: While not a direct impact, seismic surveys facilitate fossil fuel extraction, indirectly accelerating greenhouse gas emissions and habitat loss from drilling.
Mitigation Strategies and Innovations
To address these impacts, regulatory frameworks, and technological advancements are evolving:
Marine Mitigation
- Soft-Start Protocols: Gradually increasing airgun volume allows marine mammals to flee the area.
- Exclusion Zones: Halting operations when sensitive species are detected within a radius (e.g., 500 meters).
- Alternative Technologies: Marine vibroseis systems and autonomous underwater vehicles (AUVs) reduce noise pollution.
Land Mitigation
- Low-Impact Equipment: Lightweight vehicles and biodegradable lubricants minimize soil disruption.
- Seasonal Restrictions: Avoiding surveys during breeding or migration seasons protects vulnerable species.
- Reclamation Efforts: Restoring vegetation and erosion control post-survey.
- Policy and Monitoring: Stricter regulations, such as the U.S. Marine Mammal Protection Act, mandate environmental impact assessments (EIAs) and real-time monitoring.
Read More
So, you’re wondering if you can fly your drone in the rain. The answer is generally a resounding NO. Most drones—especially consumer models like the DJI Mini or Air series—aren’t waterproof.
Rai
With their six-propeller design, hexacopters stand out for their stability, payload capacity, and flight redundancy. This makes them a powerful choice for aerial photography, precision agriculture, in

JOUAV Product News and Use Cases
Fixed-Wing VTOL Drones Insights and Industry Trends
Invitations to online demo events